429 chaos experiments across 22 operators: what actually broke
In Part 1 I introduced operator-chaos and ran it against cert-manager. 18 experiments, 18 Resilient verdicts. Clean pass. That was the proof of concept: the framework works, the experiment lifecycle is sound, the verdicts are meaningful.
Then I scaled it up. 22 operators. 429 experiments. CLI mode for all of them, SDK mode (chaos-instrumented images) for 7 RHOAI operators on OpenShift 4.21.
PodKill and NetworkPartition passed almost everywhere, which is expected. Those test Kubernetes recovery, not operator reconciliation. The interesting faults were DeploymentScaleZero, ImageCorrupt, and ResourceDeletion. They exposed gaps that kubectl delete pod will never find.
The SDK testing went further. Building chaos-instrumented operator images let me inject faults at the HTTP transport layer, inside the operator process. This found 4 confirmed bugs and 2 RBAC gaps that CLI testing could not reach. One operator reported Ready=True while silently swallowing errors. Another crashed with a nil pointer dereference under API pressure. These are the kinds of failures that only show up in production, except now I can reproduce them deterministically.
The test matrix
Here’s the full set of operators I tested, with experiment counts and results. CLI mode across the board, running on kind clusters for CNCF operators and OpenShift 4.21 for RHOAI components.
| Operator | Experiments | Resilient | Degraded | Failed |
|---|---|---|---|---|
| cert-manager | 18 | 18 | 0 | 0 |
| Prometheus Operator | 12 | 12 | 0 | 0 |
| Tekton Pipelines | 16 | 16 | 0 | 0 |
| ArgoCD | 18 | 18 | 0 | 0 |
| Knative Serving | 39 | 38 | 1 | 0 |
| Knative Eventing | 14 | 14 | 0 | 0 |
| Istio | 28 | 28 | 0 | 0 |
| Kueue | 24 | 24 | 0 | 0 |
| Strimzi | 16 | 15 | 1 | 0 |
| Spark Operator | 14 | 12 | 1 | 1 |
| Flux | 12 | 12 | 0 | 0 |
| Crossplane | 10 | 10 | 0 | 0 |
| Cilium Operator | 8 | 8 | 0 | 0 |
| MetalLB | 8 | 8 | 0 | 0 |
| External Secrets | 12 | 12 | 0 | 0 |
| Grafana Operator | 10 | 10 | 0 | 0 |
| KEDA | 14 | 14 | 0 | 0 |
| Jaeger Operator | 10 | 10 | 0 | 0 |
| opendatahub-operator | 65 | 65 | 0 | 0 |
| odh-model-controller | 24 | 24 | 0 | 0 |
| kserve | 36 | 36 | 0 | 0 |
| model-registry | 21 | 21 | 0 | 0 |
| Total | 429 | 425 | 3 | 1 |
425 out of 429 Resilient. The 3 Degraded and 1 Failed verdicts are where the story gets interesting.
Finding #1: PodKill passes, DeploymentScaleZero reveals the truth
Every operator passed PodKill. That’s expected. Kubernetes Deployment controller handles pod replacement. The operator doesn’t need to do anything. This is why PodKill is a low-value experiment for operator testing: it validates the scheduler, not the reconciler.
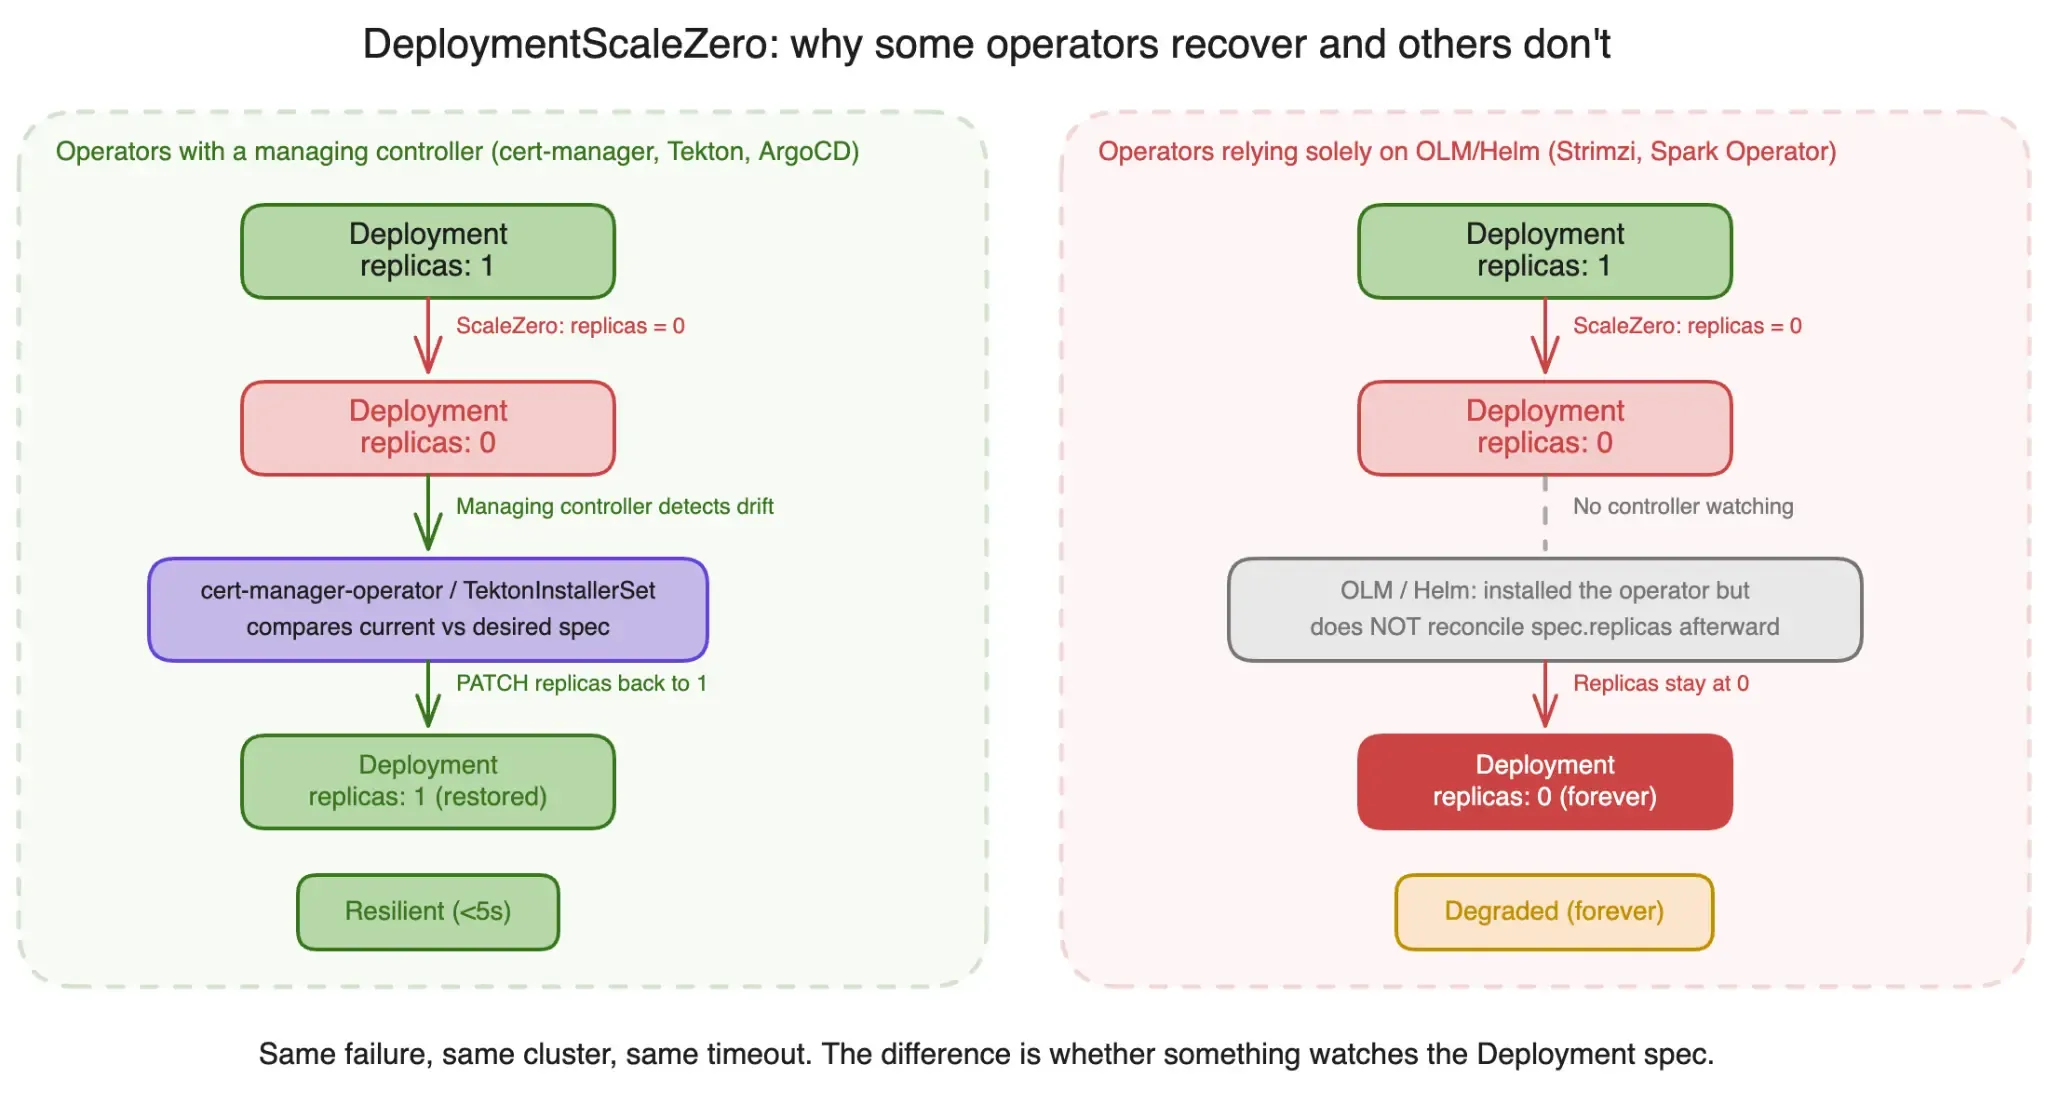
DeploymentScaleZero is the real test. It scales the operator’s Deployment to zero replicas and checks whether the replica count gets restored. This distinguishes between two fundamentally different operator management strategies:
- Active spec enforcement: the managing operator compares current state to desired state every reconcile cycle and corrects any drift
- Install-and-forget: something (OLM, Helm, a script) creates the Deployment at install time, then nothing ever checks it again
Strimzi passed 15 of 16 experiments but went Degraded on DeploymentScaleZero.
Here’s the full experiment output:
$ operator-chaos run experiments/strimzi/scale-zero.yaml \
    --knowledge knowledge/strimzi.yaml

[PRE-CHECK] Verifying steady state for strimzi-cluster-operator...
  ✓ strimzi-cluster-operator: Deployment Available (1/1 replicas)

[INJECT] DeploymentScaleZero
  Target: Deployment/strimzi-cluster-operator (namespace: strimzi)
  Action: scale replicas 1 → 0

[OBSERVE] Watching for recovery (timeout: 300s)
  +0s    replicas: 0/0, Available=False
  +10s   replicas: 0/0, Available=False
  +30s   replicas: 0/0, Available=False
  +60s   replicas: 0/0, Available=False
  +120s  replicas: 0/0, Available=False
  +180s  replicas: 0/0, Available=False
  +240s  replicas: 0/0, Available=False
  +300s  replicas: 0/0, Available=False [TIMEOUT]

[POST-CHECK]
  ✗ strimzi-cluster-operator: replicas=0, expected=1
  ✗ Deployment Available=False

[VERDICT] DEGRADED
  Recovery: FAILED (timeout after 300s)
  Deviations:
    - Deployment/strimzi-cluster-operator: spec.replicas=0, expected=1
    - Deployment/strimzi-cluster-operator: Available=False
Replicas stayed at zero for the full 5-minute timeout. No recovery. The operator was offline and nothing brought it back.
The root cause: OLM creates the operator’s Deployment from the CSV (ClusterServiceVersion) at install time, but it does not continuously reconcile the Deployment spec. The CSV stays in Succeeded phase even when the operator has zero running pods. There’s no process watching whether the operator is actually running.
This is not a Strimzi bug specifically. It’s an OLM architecture decision. Any OLM-managed operator that doesn’t have an external supervisor (like a parent operator enforcing replica counts) will exhibit this behavior. The operator gets installed, works fine, and then if anything scales it to zero, it stays dead.
Compare this to cert-manager, Prometheus Operator, ArgoCD, and Tekton. All four actively enforce replica counts through their managing operator or through Deployment controller watches. When DeploymentScaleZero fires, they detect the drift within 10-15 seconds and restore replicas.
The opendatahub-operator passed 65/65 including all DeploymentScaleZero experiments. It reconciles the full spec of every managed Deployment using server-side apply, so any drift in replicas, images, or resource limits gets corrected on the next cycle.
Finding #2: How a network partition permanently killed the Spark Operator
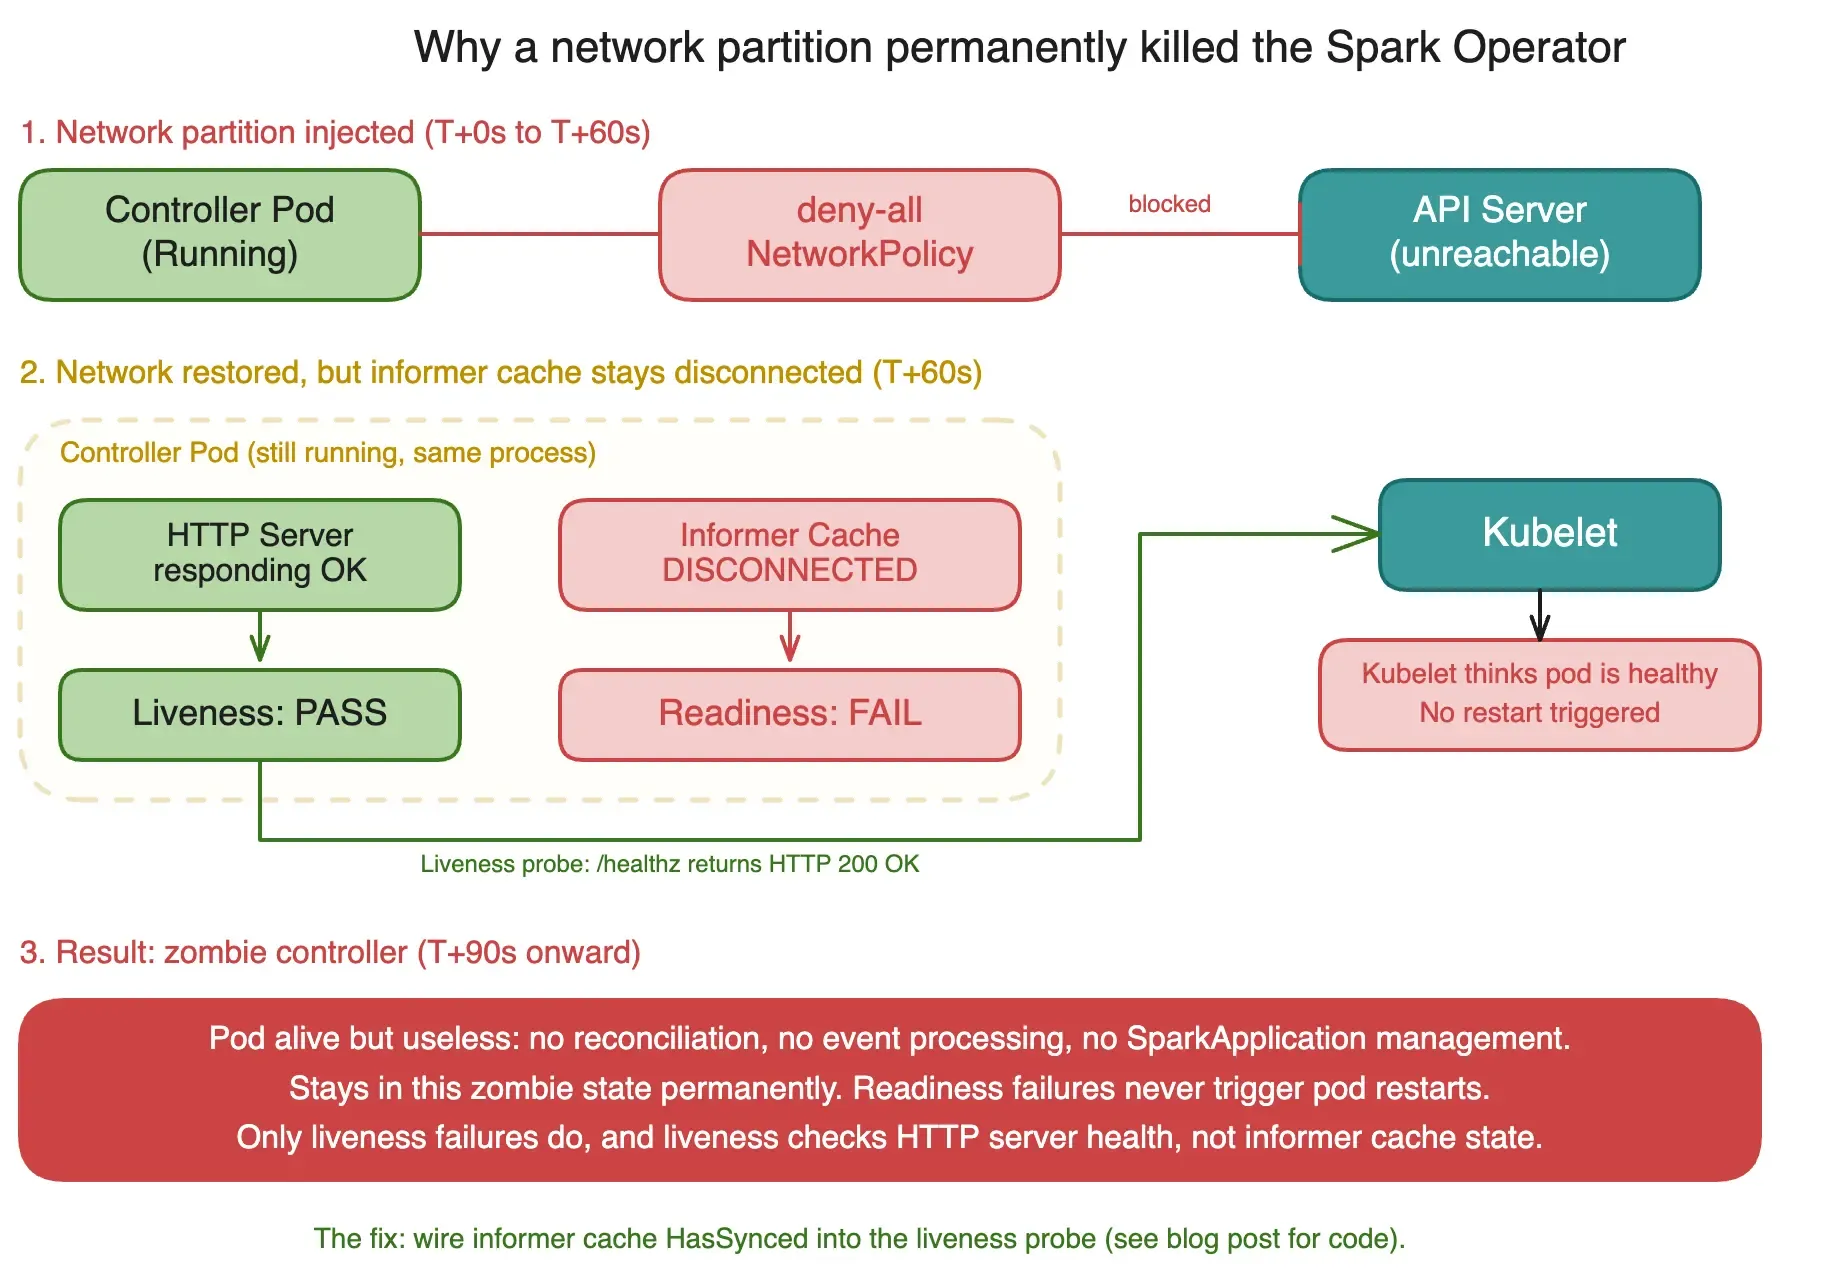
The Spark Operator was the only operator that received a Failed verdict. Not on PodKill (passed), not on DeploymentScaleZero (passed). On NetworkPartition.
Here’s what happened:
$ operator-chaos run experiments/spark/network-partition.yaml \
    --knowledge knowledge/spark.yaml

[PRE-CHECK] Verifying steady state for spark-operator...
  ✓ spark-operator: Deployment Available (1/1 replicas)

[INJECT] NetworkPartition
  Target: pods matching app.kubernetes.io/name=spark-operator
  Action: deny-all NetworkPolicy (ingress + egress)
  TTL: 60s

[OBSERVE] Watching for recovery (timeout: 300s)
  +0s    NetworkPolicy applied, partition active
  +5s    Available=True (pod still running, liveness passes)
  +15s   Available=True (kubelet sees healthy container)
  +30s   Available=True (no restart triggered)
  +60s   NetworkPolicy TTL expired, partition lifted
  +65s   Available=True (pod still running)
  +90s   Available=True, but 0 reconcile events in last 30s
  +120s  Available=True, 0 reconcile events in last 60s
  +180s  Available=False (readiness probe failing)
  +240s  Available=False, still no restart
  +300s  Available=False [TIMEOUT]

[POST-CHECK]
  ✗ spark-operator: 0 reconcile events since partition lift
  ✗ Deployment Available=False

[VERDICT] FAILED
  Recovery: FAILED (timeout after 300s)
  Deviations:
    - spark-operator: no reconcile activity post-partition
    - Deployment/spark-operator: Available=False
  Root cause: informer cache stale, liveness probe does not
    check cache sync status
This is the “zombie controller” problem. During the network partition, the operator’s informer cache loses its WATCH connection to the API server. When the partition lifts, the informer should reconnect and re-list. But the liveness probe only checks whether the HTTP health endpoint responds, not whether the informer cache is actually synced.
Kubelet sees a healthy container (liveness passes), so it never restarts the pod. Readiness failures eventually cause the pod to stop receiving traffic, but readiness failures alone do not trigger a pod restart. The operator sits there, appearing alive, processing nothing.
The fix is straightforward: wire the liveness probe to the informer cache sync status.
mgr.AddHealthzCheck("informer-sync", func(req *http.Request) error {
    if !mgr.GetCache().WaitForCacheSync(req.Context()) {
        return fmt.Errorf("informer cache not synced")
    }
    return nil
})
With this check, a stale informer cache causes the liveness probe to fail, kubelet restarts the pod, and the operator recovers with a fresh cache. Simple fix, but you’d never find it without a NetworkPartition experiment. kubectl delete pod would just restart the pod with a clean state, completely masking the bug.
Finding #3: SDK testing finds bugs CLI cannot reach
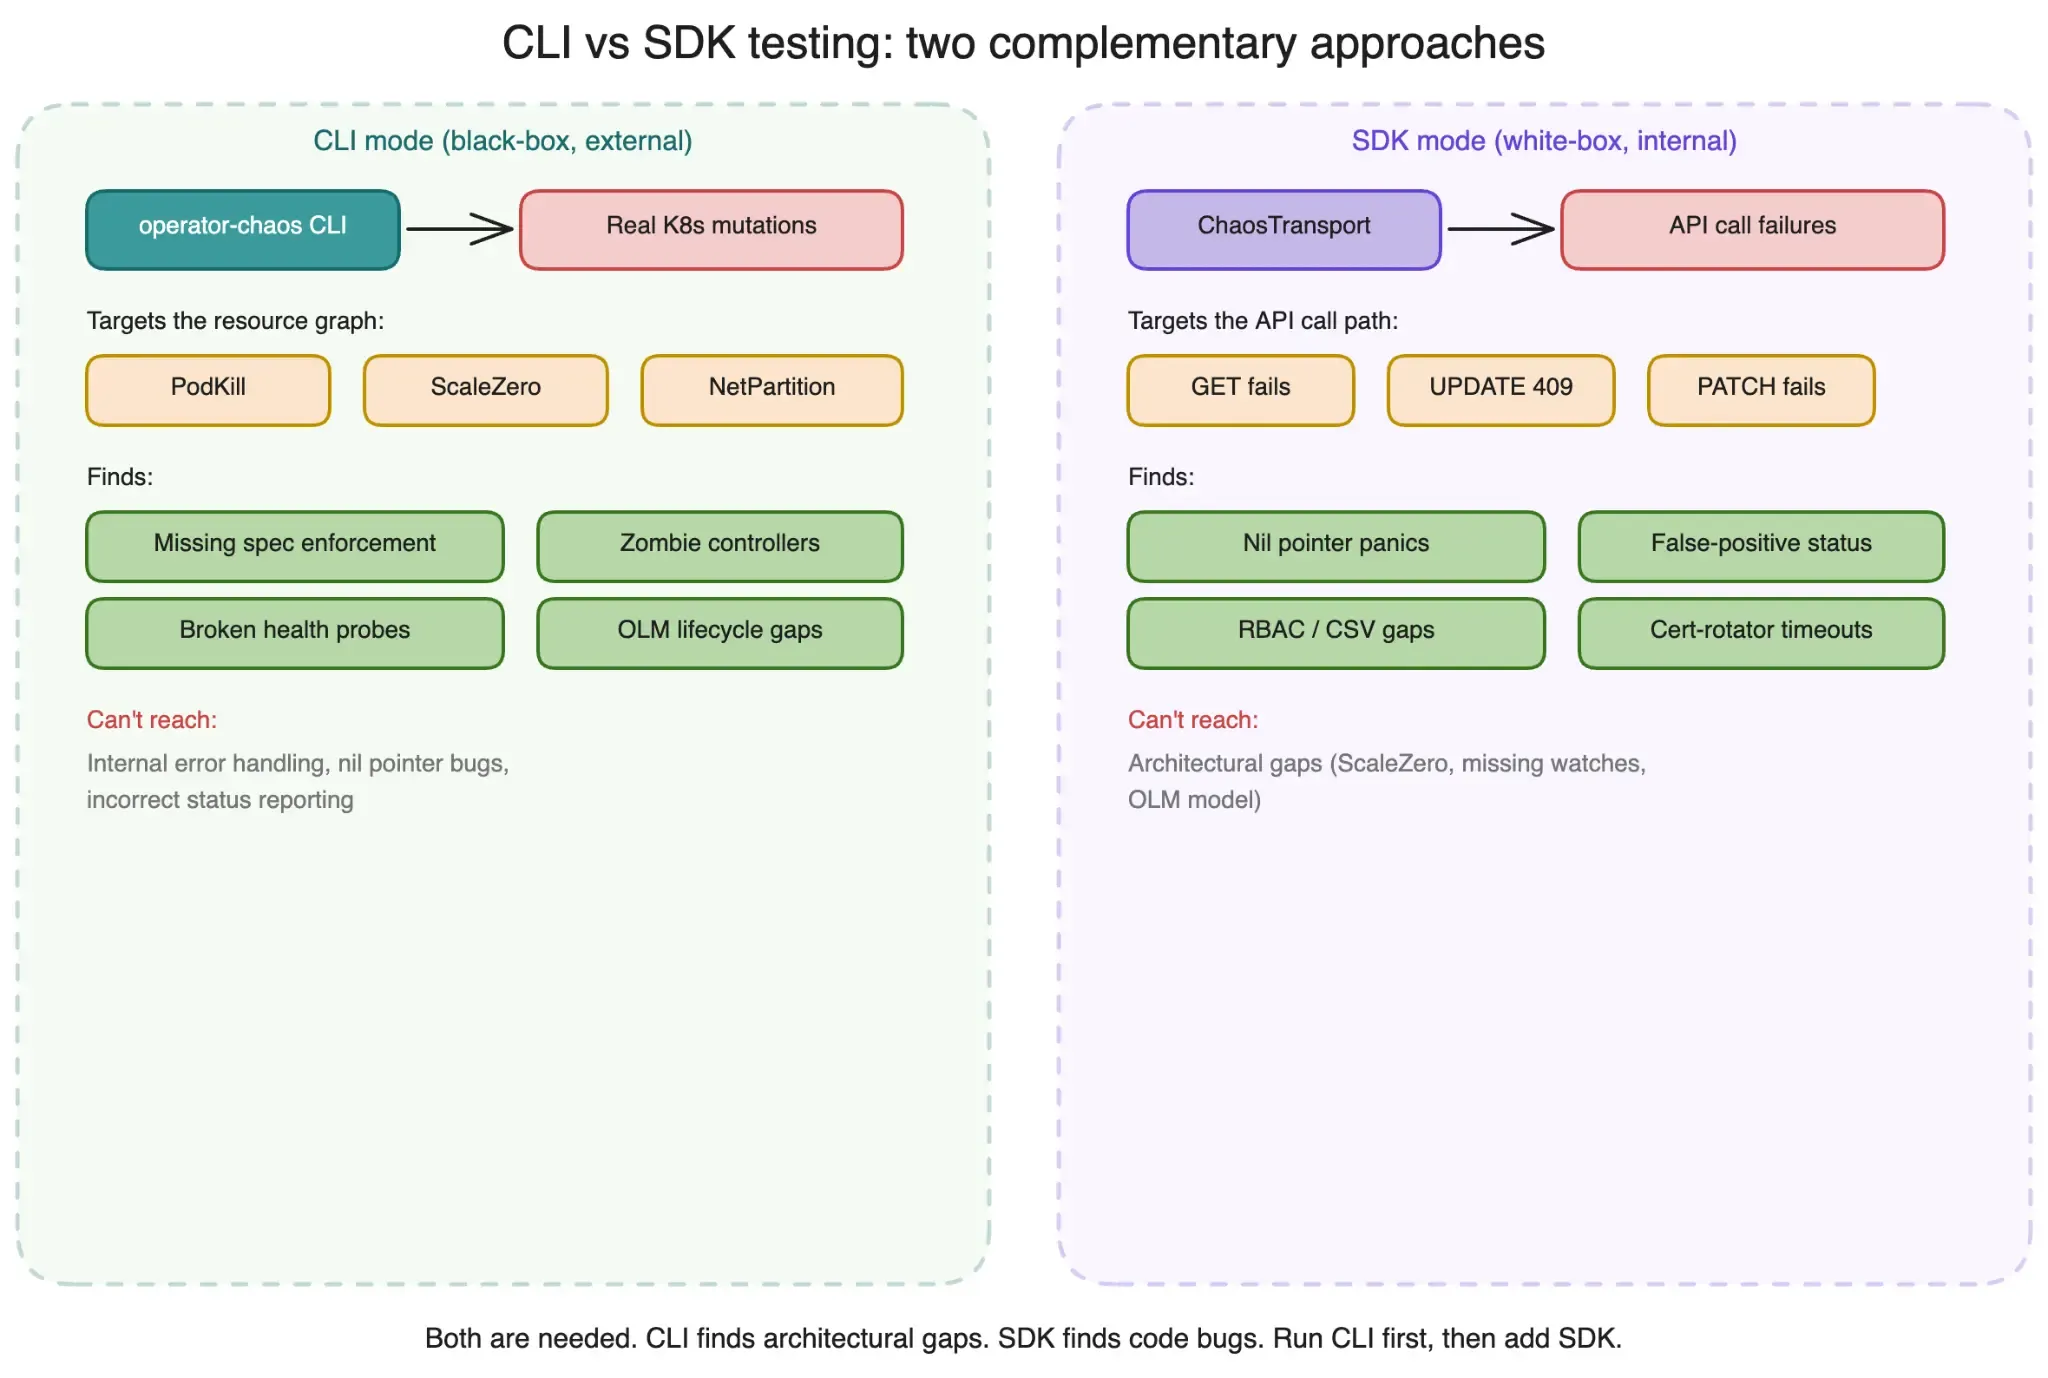
CLI mode is black-box testing. You inject faults externally (delete a pod, scale a Deployment, create a NetworkPolicy) and observe whether the operator recovers. This is valuable but limited. You can only test faults that manifest as cluster state changes.
SDK mode is white-box testing. You build a chaos-instrumented operator image with the chaostransport module injecting faults at the HTTP transport layer. Every API call the operator makes, including informer LIST/WATCH, leader election, and CRUD operations, can fail with controlled error rates.
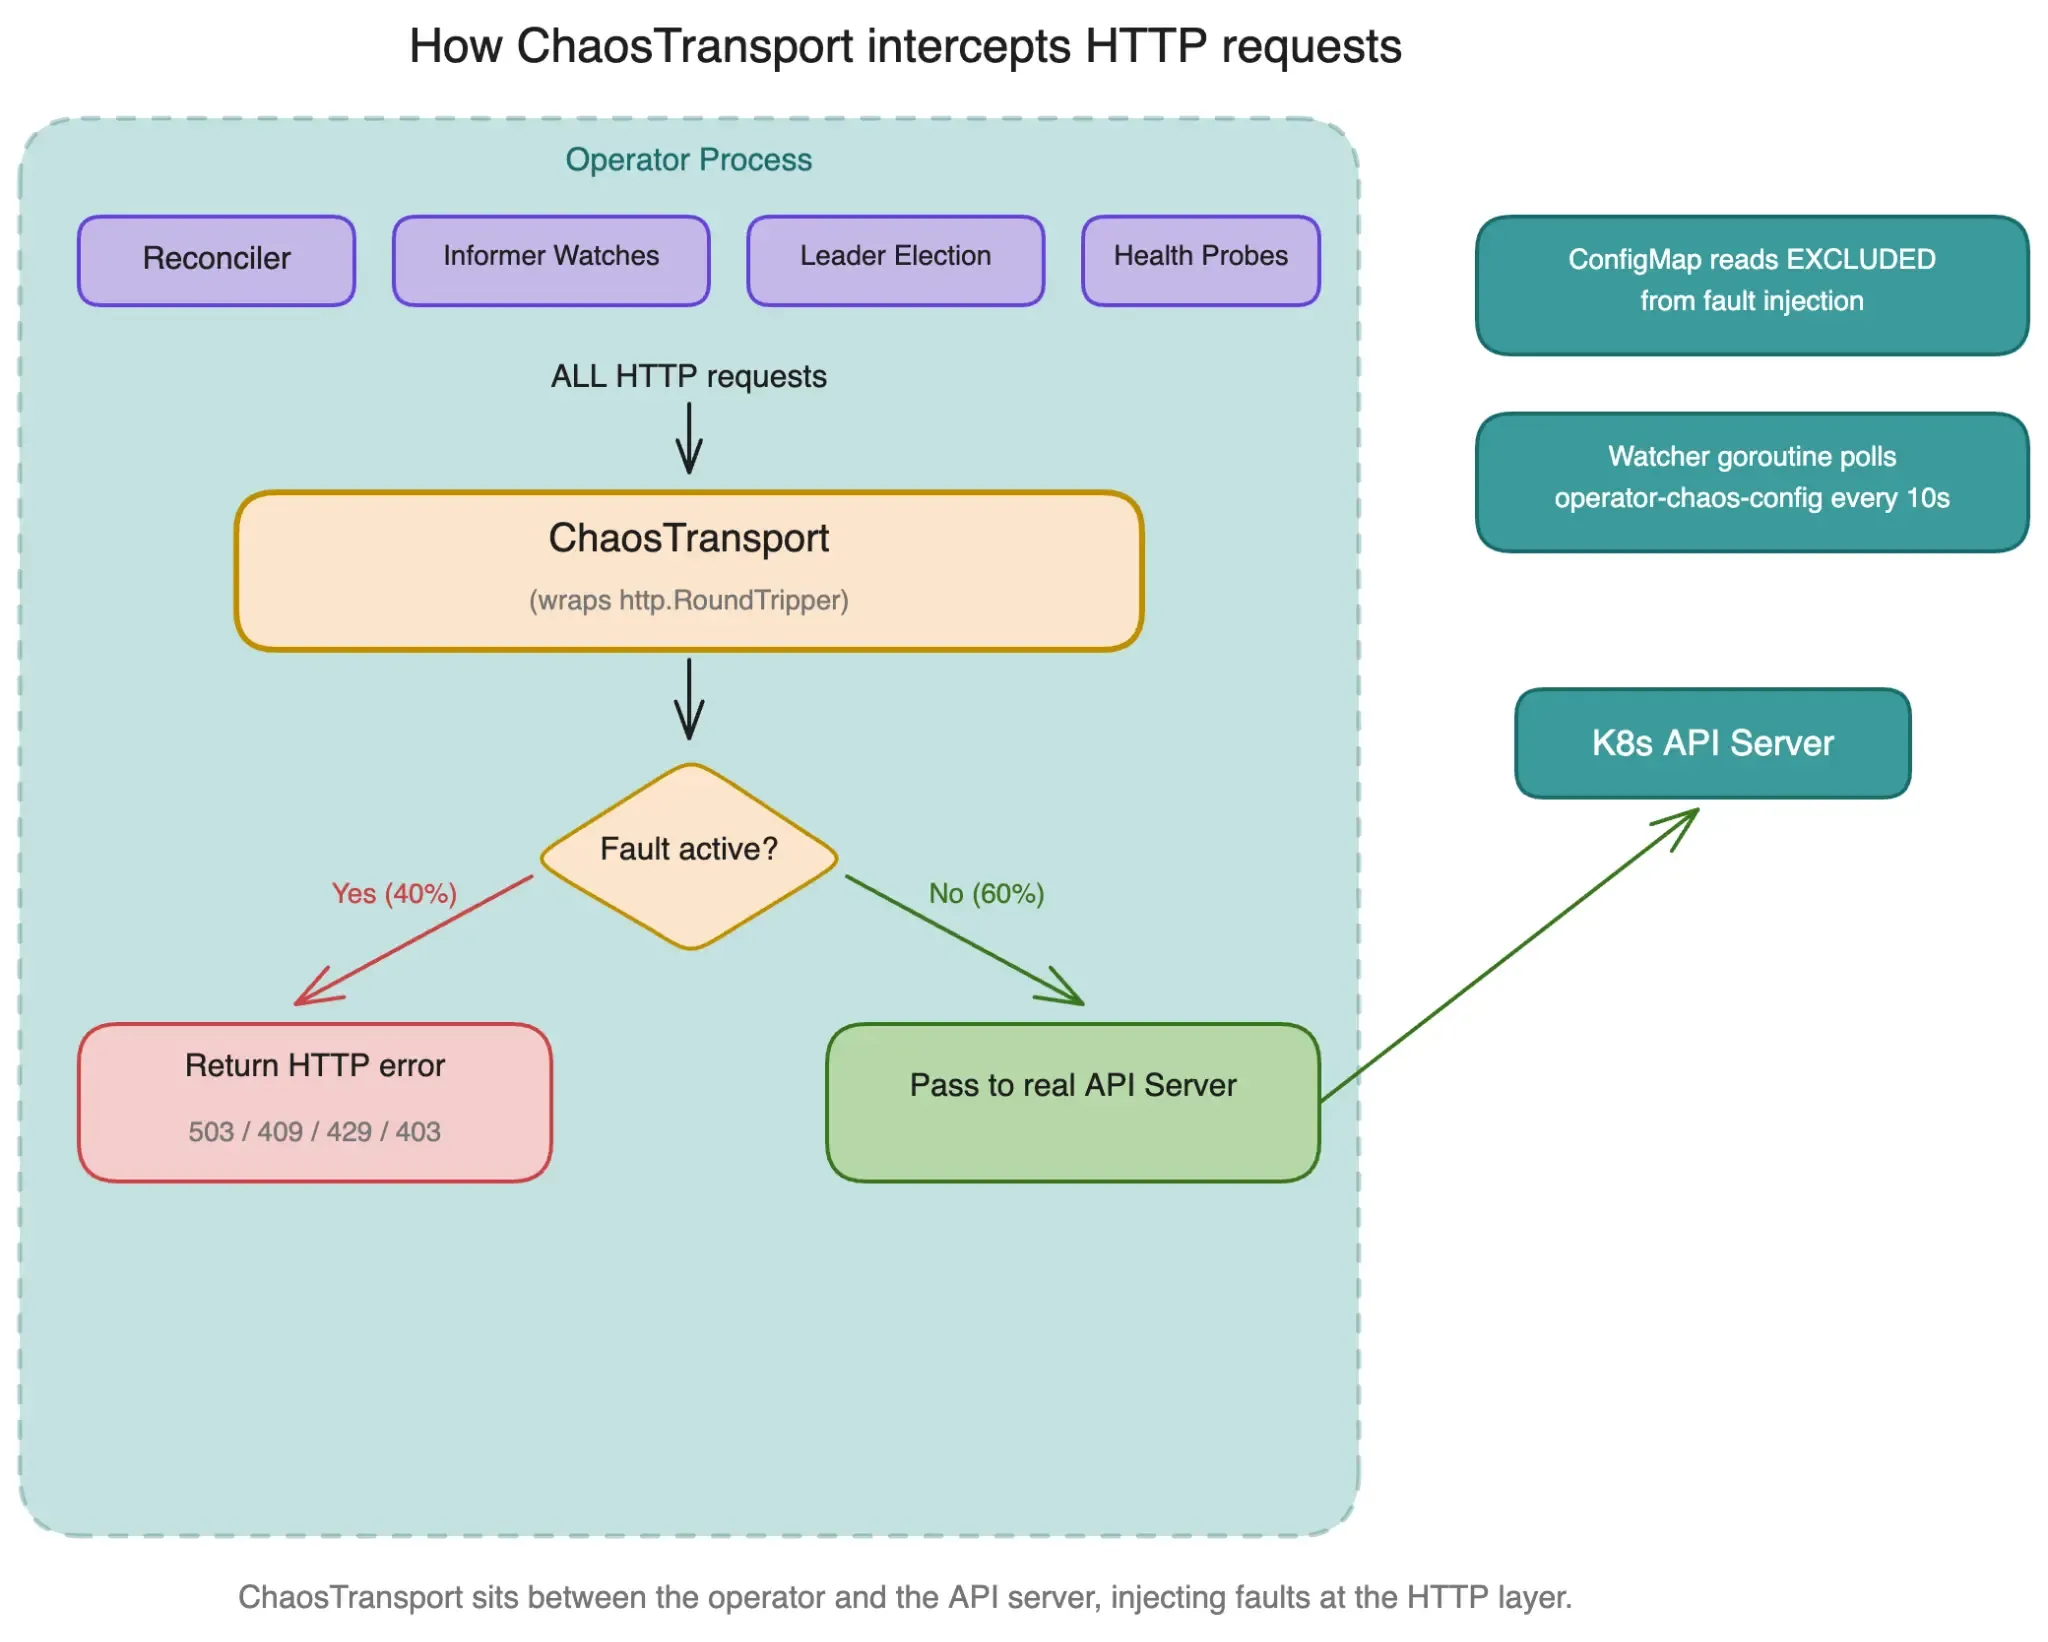
I built chaos-instrumented images for 7 RHOAI operators running on OpenShift 4.21 with ODH v3.5.0-ea.1. The fault configuration: 40% failure rate on update/patch operations, 20% on create/delete, running for 20+ minutes each. This simulates sustained API server pressure, which is exactly what happens during cluster upgrades, etcd leader elections, or noisy-neighbor situations.
SDK results
| Operator | Controllers | Verdict | Issues found |
|---|---|---|---|
| opendatahub-operator | 15 | Resilient | None (retry logic covers all paths) |
| kserve | 1 | Resilient | None |
| model-registry | 1 | Resilient | None |
| trustyai | 1 | Resilient | None |
| spark-operator | 1 | Resilient | None (under SDK faults, separate from CLI NetworkPartition finding) |
| odh-model-controller | 3 | Failed | nil pointer panic in FindSupportingRuntimeForISvc |
| training-operator | 1 | Degraded | cert-rotator cache sync timeout |
Six issues total across the 7 operators:
-
odh-model-controller: nil pointer panic.
FindSupportingRuntimeForISvcassumed a List call always returns results. Under 40% failure rate, the List returned an error, the result was nil, and the next line dereferenced it. Classic missing nil check. -
training-operator: cert-rotator timeout. The cert rotation goroutine uses a fixed timeout for cache sync. Under API pressure with 20% create failures, the sync took longer than the hardcoded deadline. The goroutine exited, leaving the operator without valid certs for webhook serving.
-
DSC controller: Ready=True while failing. The DSC (DataScienceCluster) controller in opendatahub-operator reported
Ready=Trueon its status even when individual component deploy actions were returning errors. The action pipeline was catching errors but not propagating them to the status condition. This was the most important find because it means the operator could be silently broken while the status looks healthy. Fix merged in ea.2. -
DSPO: nil pointer panic in ExtractParams. Under API pressure, a Get call for a ConfigMap returned an error, but
ExtractParamsused the result without checking the error first. Same pattern as the odh-model-controller bug. -
Two CSV RBAC gaps. Two operators were missing RBAC permissions in their ClusterServiceVersion that only manifested under retry conditions. When a create operation failed and the operator retried, it needed
updatepermission on a resource it only hadcreatefor. Both fixed in ea.2.
None of these would have been found by CLI testing. The CLI can delete a pod, but it can’t make 40% of PATCH operations return a 409 Conflict. That’s the gap SDK testing fills.
Finding #4: The dependency conflict problem
When I started building chaos-instrumented images, I hit dependency conflicts immediately. The chaostransport module needs to be imported into each operator’s codebase. 4 of the 7 operators had incompatible k8s.io versions.
The main operator-chaos SDK pulls in controller-runtime v0.19.7+ and k8s.io/client-go v0.35.x. Operators pinned to v0.18 or earlier can’t import it without a major dependency upgrade, which is not something you want to do just to run chaos tests.
This is why chaostransport exists as a separate Go module with zero external dependencies:
module github.com/opendatahub-io/operator-chaos/pkg/chaostransport

go 1.22.0
That’s the entire go.mod. No controller-runtime. No k8s.io. Only standard library. It works because the transport layer is pure HTTP. The WrapTransport field on rest.Config accepts any function that wraps http.RoundTripper, which is a standard library interface.
For trustyai, even the sub-module import path caused issues with their vendoring setup. The solution: I inlined about 250 lines of the transport wrapper directly into their source tree. No import, no dependency change, same behavior. It’s not elegant, but it works on every operator regardless of their dependency graph.
Three patterns that predict resilience
After running 429 experiments, some patterns emerged. The operators that passed everything share three characteristics. The ones that didn’t are missing at least one.
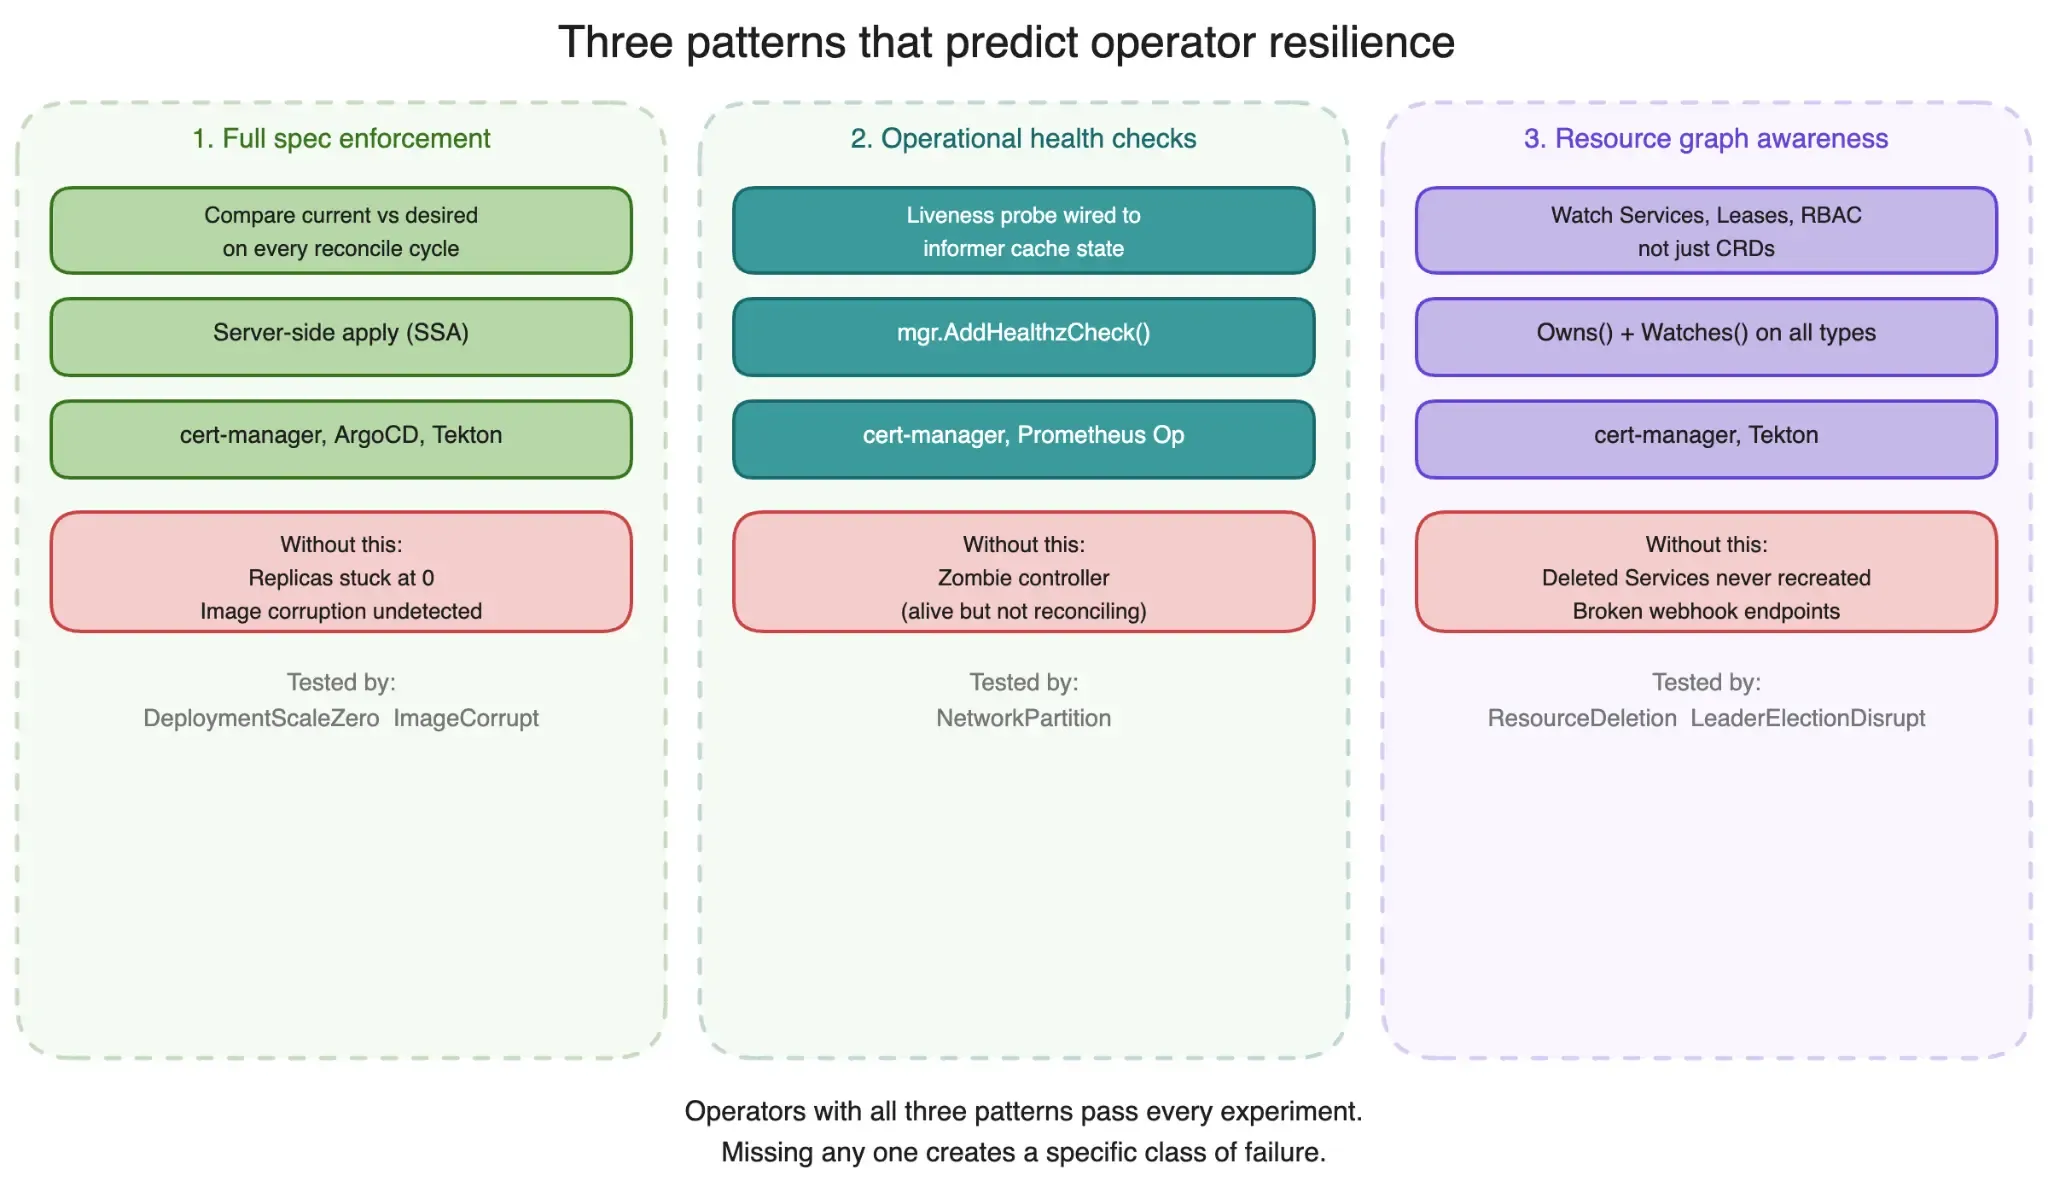
Pattern 1: Full spec enforcement
Resilient operators compare the current state of every managed resource against the desired state on every reconcile cycle, then correct any drift. They don’t just check whether the resource exists. They verify the full spec.
The opendatahub-operator uses server-side apply for this. Every reconcile cycle applies the full desired spec, which means any drift in replicas, images, labels, annotations, or resource limits gets corrected automatically. It doesn’t need special code for each field because SSA handles the merge.
Operators that use CreateOrUpdate with partial patches are more fragile. They only update the fields they explicitly set, which means drift in unmanaged fields goes undetected.
Pattern 2: Health checks reflecting operational state
The zombie controller problem with Spark shows what happens when health checks only test process health (is the HTTP server responding?) instead of operational state (is the informer cache synced? is the leader election lease held? are reconcile events flowing?).
cert-manager’s liveness probe checks informer sync status. The opendatahub-operator checks both informer sync and leader election. These operators recover from network partitions because a stale state triggers a restart.
Pattern 3: Resource graph awareness
Resilient operators watch all resources in their managed graph, not just the top-level CRDs. When a ConfigMap, ServiceAccount, or RBAC binding gets deleted, the operator detects it immediately through its watch and reconciles.
Operators that only watch CRDs miss drift in supporting resources. They’ll notice if you delete a custom resource, but deleting the ServiceAccount that the custom resource’s pod needs? That goes undetected until something crashes at runtime.
In controller-runtime terms, this means using Owns() or Watches() for every resource type the operator manages, not just For() on the primary CRD.
How to test your operator
You don’t need 429 experiments to get value from chaos testing. Start with these four and you’ll cover the most common failure modes.
Test 1: DeploymentScaleZero
The most revealing single experiment. Does anything enforce replica counts?
operator-chaos init \
    --component my-controller \
    --operator my-operator \
    --type DeploymentScaleZero > scale-zero.yaml

operator-chaos run scale-zero.yaml --knowledge knowledge.yaml
If this returns Degraded or Failed, your operator has no supervisor enforcing its replica count. For OLM-managed operators, consider adding a health check controller or using the spec.install.spec.deployments[].spec.replicas enforcement in OLM 1.0+.
Test 2: ResourceDeletion on a supporting resource
Delete a ServiceAccount, ConfigMap, or Secret that the operator created. Does the operator recreate it?
operator-chaos init \
    --component my-controller \
    --operator my-operator \
    --type ResourceDeletion \
    --target "v1/ServiceAccount/my-controller-sa" > sa-delete.yaml

operator-chaos run sa-delete.yaml --knowledge knowledge.yaml
Test 3: NetworkPartition
Create a deny-all NetworkPolicy and check whether the operator recovers after it’s removed.
operator-chaos init \
    --component my-controller \
    --operator my-operator \
    --type NetworkPartition > net-partition.yaml

operator-chaos run net-partition.yaml --knowledge knowledge.yaml
If this returns Failed with zero reconcile events post-partition, your operator has the zombie controller problem. Wire the liveness probe to informer cache sync.
Test 4: ImageCorrupt
Patch the operator’s container image to a nonexistent registry. Does the managing operator detect ImagePullBackOff and report it in status?
operator-chaos init \
    --component my-controller \
    --operator my-operator \
    --type ImageCorrupt > image-corrupt.yaml

operator-chaos run image-corrupt.yaml --knowledge knowledge.yaml
How to fix what you find
Fix: DeploymentScaleZero (Degraded)
If your operator is OLM-managed and nothing enforces replica counts, add a reconcile check in the parent operator or add a controller that watches the operator’s Deployment:
// In your parent operator's reconciler:
func (r *Reconciler) ensureOperatorRunning(ctx context.Context) error {
    dep := &appsv1.Deployment{}
    err := r.Client.Get(ctx, types.NamespacedName{
        Name:      "my-operator",
        Namespace: "my-operator-system",
    }, dep)
    if err != nil {
        return fmt.Errorf("get operator deployment: %w", err)
    }

    if dep.Spec.Replicas == nil || *dep.Spec.Replicas == 0 {
        one := int32(1)
        dep.Spec.Replicas = &one
        if err := r.Client.Update(ctx, dep); err != nil {
            return fmt.Errorf("restore operator replicas: %w", err)
        }
    }
    return nil
}
Or better, use server-side apply with the full desired Deployment spec so all fields get enforced, not just replicas.
Fix: NetworkPartition (Failed / zombie controller)
Wire liveness to informer cache sync:
mgr.AddHealthzCheck("informer-sync", func(req *http.Request) error {
    if !mgr.GetCache().WaitForCacheSync(req.Context()) {
        return fmt.Errorf("informer cache not synced")
    }
    return nil
})

mgr.AddHealthzCheck("leader-election", healthz.LeaderElectionHealthzAdaptor(
    time.Second * 20,
))
Fix: SDK bugs (nil pointer panics, silent error swallowing)
These are straightforward code fixes. The pattern is always the same: check the error before using the result.
// Before (buggy):
list := &SomeList{}
r.Client.List(ctx, list, ...)
// uses list.Items without checking error

// After (fixed):
list := &SomeList{}
if err := r.Client.List(ctx, list, ...); err != nil {
    return fmt.Errorf("list resources: %w", err)
}
// now safe to use list.Items
For the silent error swallowing pattern (DSC controller reporting Ready=True while actions fail), make sure error propagation flows from individual actions up to the status condition:
var errs []error
for _, action := range actions {
    if err := action.Execute(ctx); err != nil {
        errs = append(errs, err)
    }
}
if len(errs) > 0 {
    meta.SetStatusCondition(&dsc.Status.Conditions, metav1.Condition{
        Type:    "Ready",
        Status:  metav1.ConditionFalse,
        Reason:  "ActionsFailed",
        Message: multierror.Append(nil, errs...).Error(),
    })
}
Combined results: CLI + SDK
Here’s the full picture across both testing modes.
| Operator | CLI Experiments | CLI Result | SDK Test | SDK Result | Issues |
|---|---|---|---|---|---|
| cert-manager | 18 | 18/18 Resilient | N/A | N/A | 0 |
| Prometheus Operator | 12 | 12/12 Resilient | N/A | N/A | 0 |
| Tekton Pipelines | 16 | 16/16 Resilient | N/A | N/A | 0 |
| ArgoCD | 18 | 18/18 Resilient | N/A | N/A | 0 |
| Knative Serving | 39 | 38/39 | N/A | N/A | 1 Degraded |
| Knative Eventing | 14 | 14/14 Resilient | N/A | N/A | 0 |
| Istio | 28 | 28/28 Resilient | N/A | N/A | 0 |
| Kueue | 24 | 24/24 Resilient | N/A | N/A | 0 |
| Strimzi | 16 | 15/16 | N/A | N/A | 1 Degraded (scale-zero) |
| Spark Operator | 14 | 12/14 | SDK | Resilient | 1 Degraded, 1 Failed (zombie) |
| opendatahub-operator | 65 | 65/65 Resilient | SDK | Resilient | 1 (DSC status bug, fixed) |
| odh-model-controller | 24 | 24/24 Resilient | SDK | Failed | 1 nil pointer panic |
| kserve | 36 | 36/36 Resilient | SDK | Resilient | 0 |
| model-registry | 21 | 21/21 Resilient | SDK | Resilient | 0 |
| trustyai | N/A | N/A | SDK | Resilient | 0 |
| training-operator | N/A | N/A | SDK | Degraded | 1 cert-rotator timeout |
| DSPO | N/A | N/A | SDK | Failed | 1 nil pointer panic |
The takeaway: CLI and SDK testing are complementary, not interchangeable. CLI testing validates reconciliation semantics (does the operator restore state?). SDK testing validates error handling (does the operator crash under API pressure?). You need both.
Links and references
This is Part 2 of the operator-chaos series. Part 1 covers the framework design, knowledge models, and the cert-manager demo:
Other posts in this series:
- Protect your Kubernetes Operator from OOMKill
- 5 anti-patterns that cause Kubernetes operator vulnerabilities
- Why your RBAC linter misses privilege escalation chains
Also published on Red Hat Developer:
- Protect your Kubernetes Operator from OOMKill
- 5 anti-patterns that cause Kubernetes operator vulnerabilities
The full source, documentation, and 25 built-in knowledge models are at github.com/opendatahub-io/operator-chaos.
If you maintain an operator and want to start testing, grab the four experiments from the “How to test your operator” section above. They take 10 minutes to set up, and the DeploymentScaleZero result alone will tell you more about your operator’s resilience than any amount of kubectl delete pod.